MCScanX的简介
MCScanX:Multiple Collinearity Scan toolkit是一种算法,扫描多个基因组或亚基因组,以识别假定的同源染色体区域,然后使用基因定位这些区域。它的速度很快,操作简单,便于使用,是我们在进行基因共线性分析时的一个利器。
今天我们就来学习一下如何使用这个利器来帮助我们分析生物学问题
MCScanX的下载与安装
下载软件
1 | wget http://chibba.pgml.uga.edu/mcscan2/MCScanX.zip |
解压
1 | unzip MCScanX.zip |
到安装目录之后,给
- msa.h
- dissect_multiple_alignment.h
- detect_collinear_tandem_arrays.h
这三个文件前面添加上\#include <unistd.h>,原因是软件不支持64位操作系统,然后make一下就安装完成了。
原始数据的准备
我们这里使用陆地棉TM-1的基因组数据作为原始数据,去探究棉花两个亚基因组之间的共线性。
首先下载数据
1 | wget http://cotton.hzau.edu.cn/EN/data/download/Ghirsutum_genome_HAU_v1.1.tar.gz |
然后解压
1 | tar -zxvf Ghirsutum_genome_HAU_v1.1.tar.gz |
我们需要Ghirsutum_gene_model.gff3、Ghirsutum_gene_peptide.fasta这两组数据,我们来看看两组数据长什么样
gff文件
下面是Ghirsutum_gene_model.gff3文件
1 | Ghir_A01 Ghir_EVM gene 80323913 80324566 . + . ID=Ghir_A01G013980;Name=Ghir_A01G013980 |
软件需要的gff文件格式为
1 | sp# gene starting_position ending_position |
所以我们可以使用linux指令中的awk去处理我们的文件,指令如下
1 | awk -F "\t" '{a=substr($9,4,15)}$0~/gene/{print $1 "\t" a".1" "\t" $4 "\t" $5}' Ghirsutum_gene_model.gff3 >At-Dt.gff |
因为我们的gff文件中的基因名最后是没有.1的,但是我们使用了每一个基因的第一个蛋白质序列,所以两个输入文件中的基因名不同,我们可以将gff文件中的基因名后面加上.1
蛋白质序列文件
然后就是Ghirsutum_gene_peptide.fasta文件
1 | >Ghir_A01G000010.1 |
每个基因可以预测出多个蛋白质序列,我们这里同统一采用.1结尾的序列,并且我们需要比对的是A亚组和D亚组,所以我们就要把A亚组和D亚组的蛋白质序列数据分开,指令如下
1 | awk 'NR==1&&$1~/^>/{print $0}NR>=2&&$1~/^>/{print "\n"$0}$1~/^[^>]/{printf $0}' Ghirsutum_gene_peptide.fasta |grep '^>Ghir_A' -A 1|grep '\.1$' -A 1 |sed '/--/d' >At.fasta |
blast结果文件
建库
1 | makeblastdb -in At.fasta -dbtype prot -parse_seqids -out Atdb |
这里选择两个亚基因组中的任意一个建库即可
比对
1 | blastp -query Dt.fasta -db Atdb -out At-Dt.blast -evalue 1e-10 -num_threads 30 -outfmt 6 -num_alignments 5 |
参数解释如下
1 | -query 被比对的物种的蛋白质文件 |
这一步是限速步骤,会花费一些时间
运行结束后会得到一个名为At-Dt.blast的文件,这是我们软件需要的输入文件之一。
至此为止我们就得到了两个软件的输入文件At-Dt.blast``At-Dt.gff
注意事项
如果比较多个基因组之间的共线性,我们要将这些物种的gff文件cat在一起
两个输入文件里边的基因名必须一致,一定要仔细检查
软件的运行
将上一步生成的At-Dt.blast和At-Dt.gff放到新建的At-Dt文件夹内,然后输入指令
1 | MCScanX ./At-Dt |
经过短暂的时间后,就会生成一个文件At-Dt.collinearity和一个文件夹At-Dt.html
At-Dt.collinearity里记录了共线性信息,可以清楚的看到共线性基因的数目比例以及具体的比对信息
下游分析
这里主要讲可视化分析,这里有四种图供我们选择
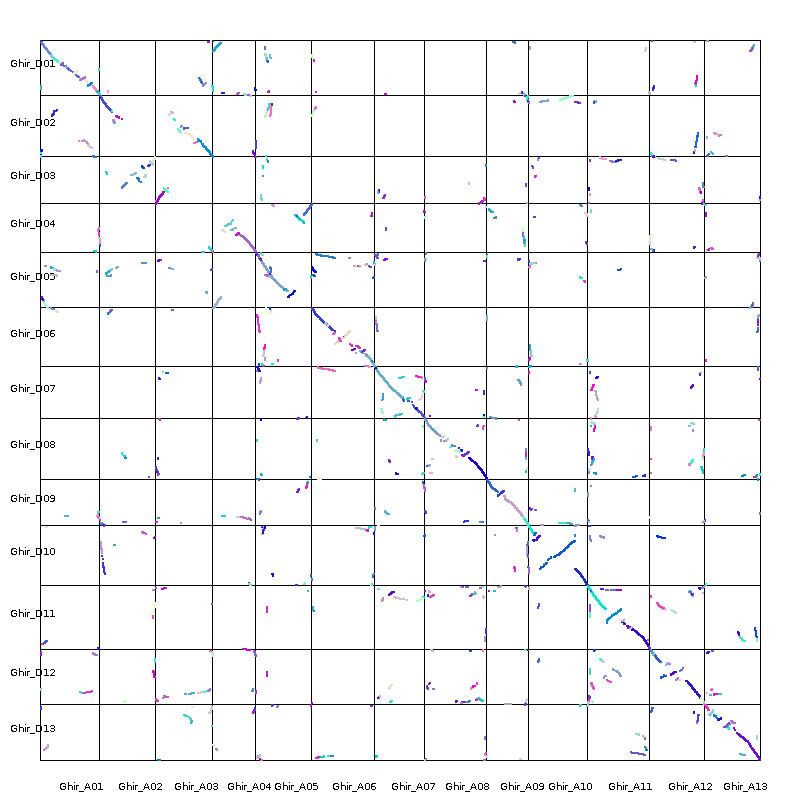
dot_plotter
首先我们需要修改MCScanX/downstream_analyses里边的dot.ctl这个control文件,如下
1 | 800 //dimension (in pixels) of x axis |
主要修改的部分就是染色体名字,想画哪条染色体就把那一条染色体写进去就可以了,染色体名字要和gff文件中的染色体名字相同,然后运行代码
1 | java dot_plotter |
- -g后面是gff文件
- -s是得到的后缀为collinearity的结果文件
- -c是我们需要修改的control文件
- -o是输出的文件名称
各个文件的路径要指定明确,之后会得到图片如下

如果有使用Xshell运行上述代码时提示需要下载Xmanager的小伙伴,可以参考主页文章04vscode与服务端R交互
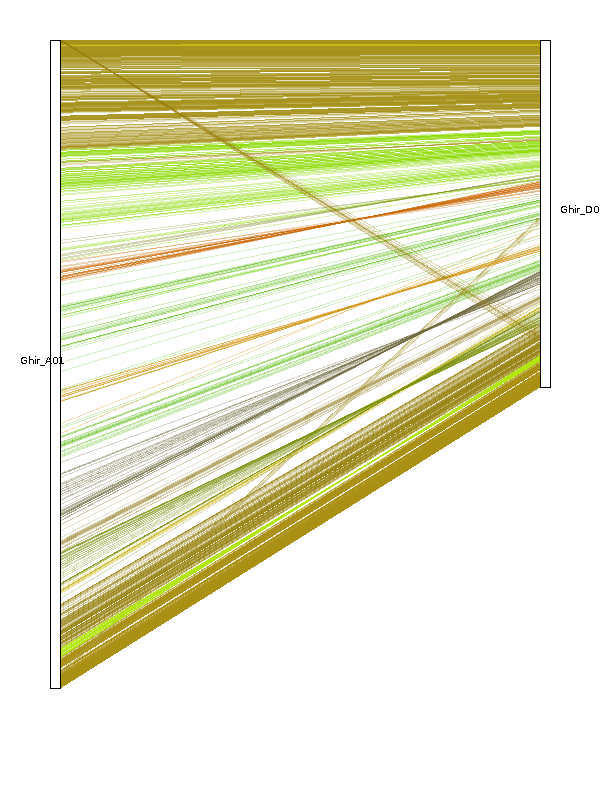
dual_synteny_plotter
dual_synteny.ctl文件
1 | 600 //plot width (in pixels) |
指令如下
1 | java dual_synteny_plotter |

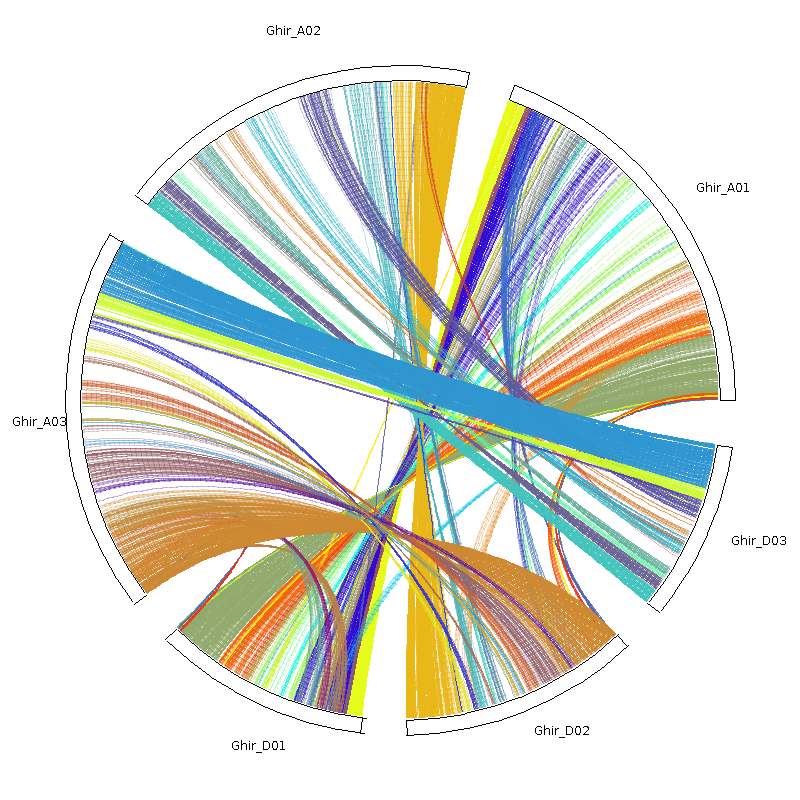
circle_plotter
circle.ctl文件
1 | 800 //plot width and height (in pixels) |
指令如下
1 | java circle_plotter |

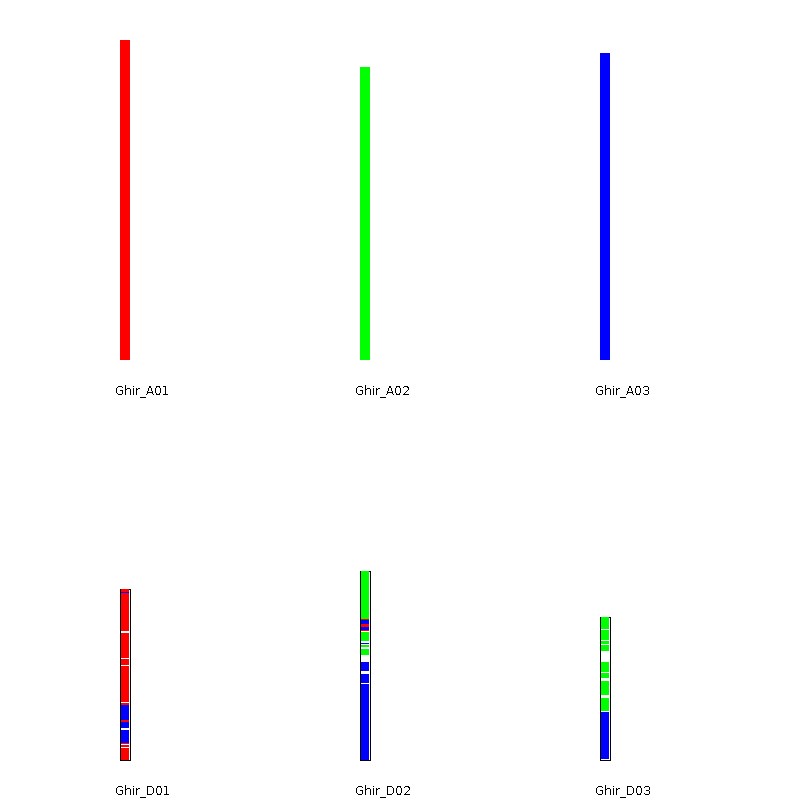
bar_plotter
bar.ctl文件
1 | 800 //dimension (in pixels) of x axis |
指令如下
1 | java bar_plotter |

至此我们就基本掌握MCScanX的用法,还有一些其他的下游分析,可以参考官网
如果想画出更美观的图片,可以参考我们的后续文章,会教大家如何处理MCScanX的结果文件然后使用circos画出更好看的圈图

